Listen to your polar pattern
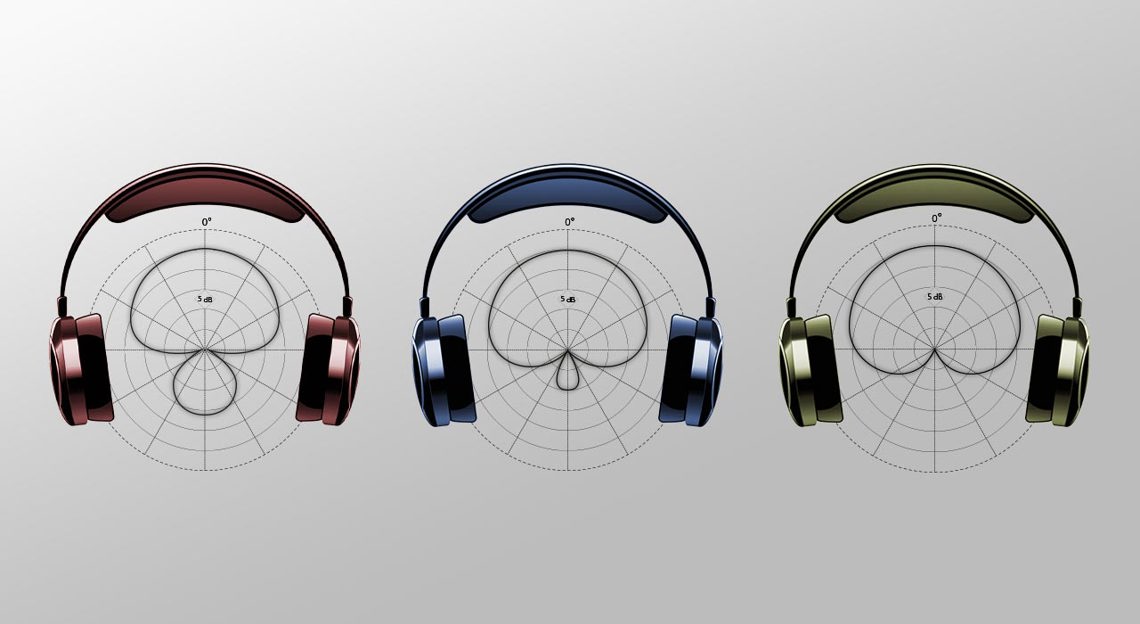
One factor differentiating microphones from each other is directivity; how much sound the microphone picks up in a given direction. Usually, polar plots are used to explain the directivity. However, it is not always easy to judge the effect of the given polar pattern on the recorded sound.

To help understand the effect, this article presents some standard directivity patterns, illustrated by graphics and sound. To make these illustrations we used pink noise, which is a sound containing all frequencies. In this case, it is the ideal polar pattern, which is constant with frequency.
Omnidirectional polar patter
The response curve follows the outer circle of the plot all the way around because the microphone picks up sound evenly from all directions.
Wide cardioid (also called hypocardioid or subcardioid) polar pattern
The microphone picks up sound from all directions. However, the sound from the rear is attenuated by approximately 7-8 dB.
Attenuation 3 dB @ 90°.
Attenuation 6 dB @ 135°.
Open cardioid polar pattern
The microphone generally has a well-controlled attenuation of sound coming from the rear, typically around 18 dB.
Attenuation: 3 dB @ 71°.
Attenuation 6 dB @ 98°.
Cardioid polar pattern
The microphone picks up sound from the front and the sides but not from the back.
Attenuation 3 dB @ 66°.
Attenuation 6 dB @ 90°.
Supercardioid polar pattern
The microphone picks up sound from the front and a little from the rear but is deaf to sound at approximately ±135°. It should be noted that the polarity is inverted on signals picked up by the rear lobe.
Attenuation 3 dB @ 58°.
Attenuation 6 dB @ 78°.
Hypercardioid polar pattern
The microphone picks up sound from the front and some from the rear but is deaf to sound at approximately ±115°. It should be noted that the polarity is inverted on signals picked up by the rear lobe.
Attenuation 3 dB @ 55°.
Attenuation 6 dB @ 73°.
Figure of eight polar pattern
The microphone picks up sound equally from the front and the rear, but not from the sides. It should be noted that the polarity is inverted on signals picked up by the rear lobe.
Attenuation 3 dB @ 54.
Attenuation 6 dB @ 73°.
When the directionality is not homogeneous
Ideally, the polar pattern should stay the same at all frequencies. But it seldom does. The polar pattern may change with frequency. That is why one polar plot may contain several curves, each describing the directivity at a given frequency band, typically applying a 1-octave bandwidth. I.e., the 1 kHz octave band encompasses all frequencies from 707 Hz to 1414 Hz, the 2 kHz octave band contains frequencies from 1414 Hz to 2828 Hz, and so on.
This last example is constructed to illustrate when the polar pattern changes with frequency. This exaggerated version may provide a good understanding of the change of timbre which may occur, when the polar patterns are not congruent at all frequencies.

